Sensitivity and Validation Analysis
Introduction
We conduct several analyses to assess the sensitivity of our findings to changes to methodology and to assess the validity of our findings under our chosen methodology. We describe two of those analyses below.
“Fixed Effects” Robustness Check
We use a fixed-effects model to generate cumulative VAE estimates for a subset of students in our sample of associate’s degree-seekers and certificate-seekers for whom we had significant earnings histories.
Cumulative VAE estimates from our core approach and from our fixed-effects model are similar, particularly for associate’s degree-seeking students. We view this result as evidence of the accuracy and validity of our research design.
Exhibit SD2: Fixed Effects Robustness Check for Associate's Degree Seekers

Exhibit SD3: Fixed Effects Robustness Check for Certificate Seekers

We could not use a fixed-effects model to generate cumulative VAE estimates for students seeking bachelor’s degrees since we are limited in our main treatment cohort of bachelor’s degree-seeking students to students who graduated in 2007-08 and who have no meaningful earnings histories.
“Simple Comparison Group” Sensitivity Check
To test the sensitivity of our cumulative net VAE estimates to more or less valid comparison groups, we generate alternative estimates for our 2008-09 institutional cohorts (for all three degree types) based on intentionally “simple” comparison groups in which we only use age to match students to comparison group individuals and in which we refrain from matching on a wide range of other attributes available to us. In this exercise, we refrain from matching individuals in comparison groups to students in our treatment cohorts on a wide range of factors, including household income, prior earnings, prior postsecondary attainment, and high school test scores.
In this “simple” approach to assembling comparison groups, cumulative VAE increased by ~$27,000 (33%), ~$13,000 (76%), and ~$6,000 (98%) for bachelor’s degree-seeking, associate’s degree-seeking, and certificate-seeking students, respectively.
Exhibit SD4: “Simple” Comparison Group Sensitivity Check
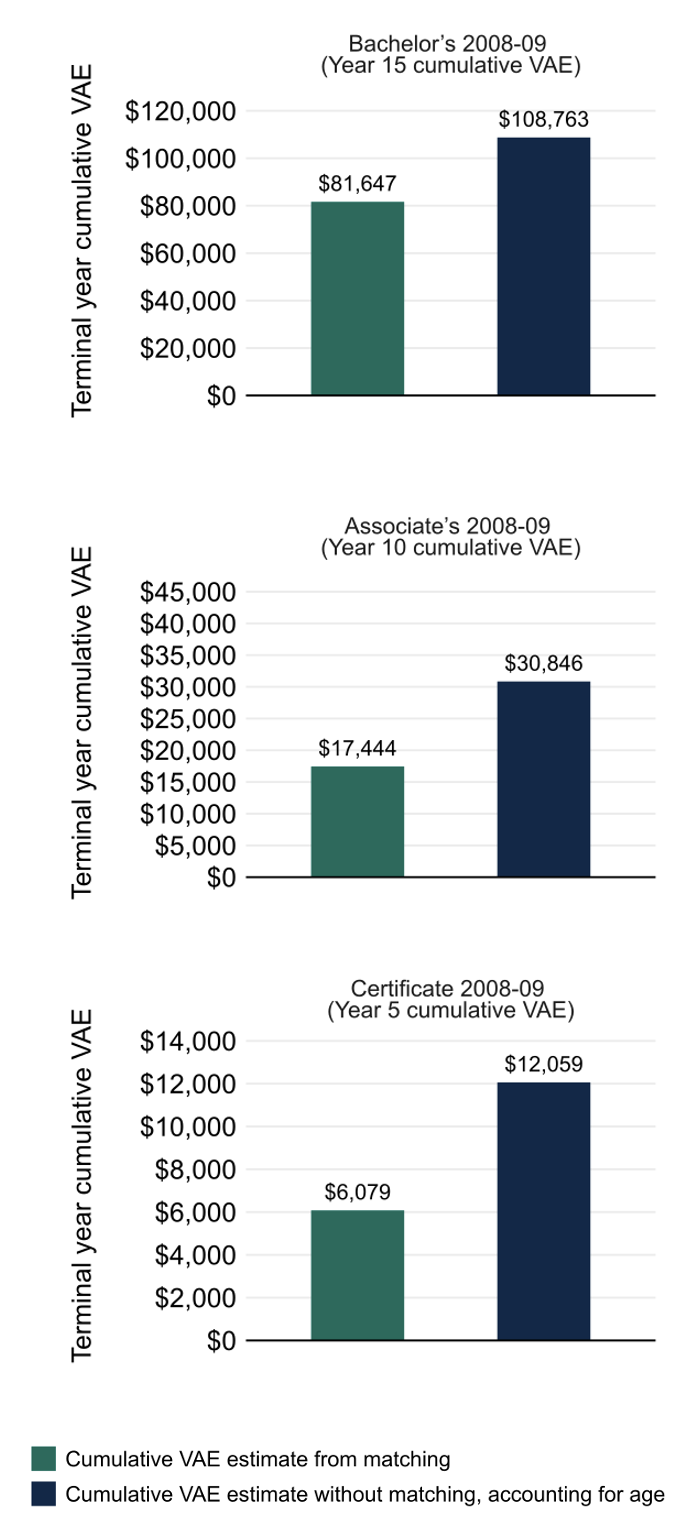
We find this result intuitive and predictable. We would expect our “simple” comparison groups to yield lower comparison group earnings (and therefore higher VAE for treatment cohorts) since individuals in our “simple” comparison groups have fewer of the characteristics associated with higher earnings of the students in our treatment cohorts.
We view this result as evidence of the importance of efforts to measure value-added earnings outcomes of careful, accurate approaches to estimating counterfactual earnings.