Bachelor's Degree Seekers: Institutional Cohorts
Main Findings
Introduction
Findings for bachelor’s degree-seeking students on this page are based on analysis of 309,213 bachelor’s degree-seeking students who entered one of 29 public institutions of higher education in Texas. 28,614 of them entered in 2008-09 and have completed the full 15-year follow-up period. 280,599 of them entered from 2009-10 through 2013-14 and have completed 10-14 years of the full 15-year follow-up period.
Cumulative net VAE values are averages, stated in 2023 dollars, for cohorts of entering students that include a mix of eventual completers and non-completers.
Cumulative Net VAE
Bachelor’s degree-seeking students who entered public institutions of higher education in Texas in 2008-09 on average experienced cumulative net VAE of $86,806 in year 15 after entry.
These students’ cumulative net VAE reached a low point of -$33,925 in year 5 after entry, when their combined losses from paying tuition and fees and from foregone earnings peaked.
In year 10 after entry, these students reached a financial break-even point when their cumulative net VAE turned positive for the first time.
Exhibit B1. Cumulative Net VAE for Bachelor’s Degree-seeking Students, Entry Year 2008-09

Exhibit Note: Cumulative net VAE values in this exhibit are averages, stated in 2023 dollars, for cohorts of entering students that include a mix of eventual completers and non-completers.
Disaggregation of Cumulative Net VAE
For bachelor’s degree-seeking students who enrolled in 2008-09, the table below disaggregates cumulative net VAE into its cost and earnings components.
An important insight from the table below is that students’ cumulative net cost of attendance (which sum to $13,349) is smaller than their cumulative losses in foregone earnings (which peak at -$21,776 in year 5).
Exhibit B2. Disaggregation of Cumulative Net VAE for Bachelor’s Degree-seeking Students, Entry Year 2008-09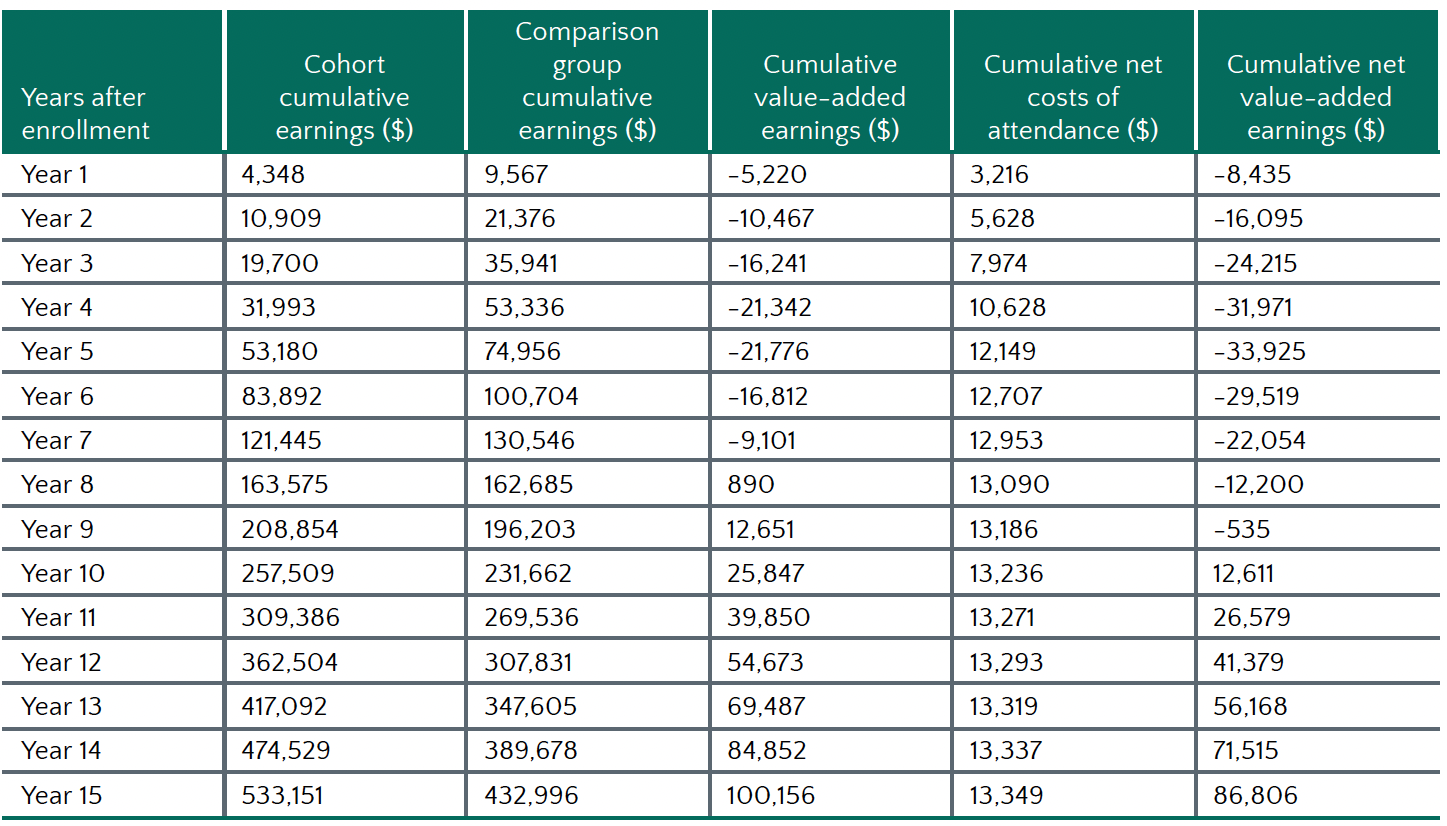
Exhibit Note: Cumulative net VAE values and other values in this exhibit are averages, stated in 2023 dollars, for cohorts of entering students that include a mix of eventual completers and non-completers.
Cumulative Net VAE by Entry Year
The exhibit below plots cumulative net VAE for the six single-year cohorts of bachelor’s degree-seeking students who enrolled from 2008-09 through 2013-14, including five entering cohorts from 2009-10 through 2013-14 that have completed only 10-14 years of the 15-year follow-up period for bachelor’s degree-seeking students.
Cumulative net VAE was similar across these six cohorts. In year 10 after entry, which is the last year in which data on all six single-year cohorts is available, students in all six single-year cohorts reached a similar financial break-even point when their cumulative net VAE turned positive for the first time.
Exhibit B3. Cumulative Net VAE for Bachelor’s Degree-seeking Students, Individual Entry Years 2008-09 through 2013-14

Exhibit Note: Cumulative net VAE values in this exhibit are averages, stated in 2023 dollars, for cohorts of entering students that include a mix of eventual completers and non-completers. The 2008-09 cohort graphed above is comprised of 28,614 bachelor’s degree-seeking students. The 2009-10 through 2013-14 cohorts graphed above are comprised of 280,599 bachelor’s degree-seeking students.
Cumulative Net VAE by Institution
Twenty-seven (93%) of 29 institutional cohorts of bachelor’s degree-seeking students who enrolled in 2008-09 experienced positive cumulative net VAE.
Cumulative net VAE for these institutional cohorts ranged widely from $174,632 (for the highest-performing institutional cohort) to -$14,803 (for the lowest-performing institutional cohort).
Exhibit B4. Cumulative Net VAE for Institutional Cohorts of Bachelor’s Degree-seeking Students, Entry Year 2008-09

Exhibit Note: Cumulative net VAE values in this exhibit are averages, stated in 2023 dollars, for cohorts of entering students that include a mix of eventual completers and non-completers.
Correlation to Completion Rates
Cumulative net VAE for cohorts of bachelor’s degree-seeking students who enrolled in 2008-09 correlates positively with the percentage of a cohort that completed a bachelor’s degree (at the institution or elsewhere) during the 15-year post-entry follow-up period.
Exhibit B5: Cumulative Net VAE versus Completion Rate of Bachelor’s Degree-seeking Students, Entry Year 2008-09

Exhibit Note: The x-axis in this exhibit plots the percentage of a cohort that completed a bachelor’s degree (at the institution or elsewhere) during the 15-year post-entry follow-up period. Cumulative net VAE values in this exhibit are averages, stated in 2023 dollars, for cohorts of entering students that include a mix of eventual completers and non-completers.